The graph shows the daily cycle of illumination (green line), as well as temperature climbing during the day (red line). The temperature goes way, way up when the sun hits the temperature sensor directly. Perhaps I should find some shade for it. For one day, the data went crazy; this is where the wires from the sensor got knocked out of the Arduino by the vacuum cleaner.
The SheevaPlug and Arduino
The Arc web server is running on the ARM-based SheevaPlug, a small Linux server that plugs into the wall. It is connected by USB to an Arduino microcontoller, which does the analog to digital conversion. In the photo, the SheevaPlug also has an Ethernet cable attached. A 4-conductor wire connects the Arduino to the temperature and light sensors outside. This wire is old phone cable, but as described below, I probably should have used something more shielded.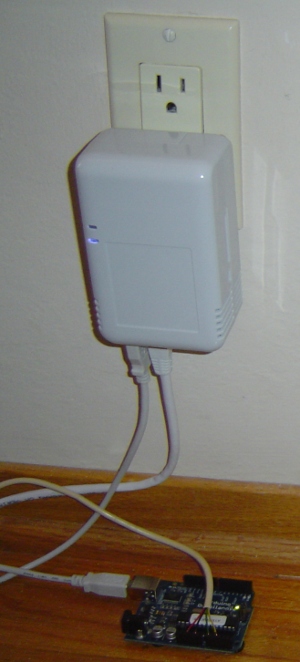
The Arduino code
The Arduino sketch (download) simply reads the voltages and writes them to the serial port:
#define SUPPLY 5.14 // Supply voltage (measured)

void setup() {
  Serial.begin(9600);
}

void loop() {
  float v = analogRead(TEMP_PIN) * SUPPLY / 1024;
  float c = (v - .5) * 100;
  Serial.print(c);
  Serial.print(" ");
  Serial.println(analogRead(SUN_PIN), DEC);
  delay(5000);
}
Note that I've hardwired the supply voltage, as it's needed for the conversion. The Celsius temperature is obtained directly from the measured voltage (10mV per degree, and offset by .5V to allow negative temperatures).
The Arc code
The Arc server code (download) is straightforward. It leverages my earlier Arc example server code (download).A background thread fetches the time / sun data lines from the serial port and writes the data to a file. It converts Celsius to Fahrenheit and limits the updates to one per minute:
(def logdata ()
  (w/appendfile outf "/tmp/data"
    (w/stdout outf
      (w/infile serial "/dev/ttyUSB0"
        (let oldtimestamp nil
          (while 1
            (with ((degc sun) (tokens (readline serial))
                  timestamp (gettimestamp))
              (when (isnt timestamp oldtimestamp)
                (let degf (+ 32 (* 9. (/ (coerce degc 'num) 5.)))
               (prn timestamp " " (num degf 2) " " sun)
                  (= oldtimestamp timestamp))))))))))

(new-bgthread 'logdata (fn () (logdata)) 0)
The simple web page is generated in Arc, but the graph itself is generated by gnuplot. Since this is currently a static page, it's a bit of overkill to use the Arc functions to generate the page.
(defop temperature req
  (system "gnuplot < gnuplotcmd")
  (page
    (tag h1 (prn "Temperature and light: Arc + Arduino + ARM"))
    (gentag img src "/graph.png")
    (tag br)
    (prn "This web page is being served by the") (link "Arc language" "http://www.righto.com/doc/index.html") (pr " web server running on a ")
    (link "SheevaPlug" "http://www.righto.com/2009/06/arduino-sheevaplug-cool-hardware.html")
    (pr " plug computer.") (pr "  For more details see ")
    (link "arcfn.com" "http://www.righto.com")
    (pr ".")
    (para)
    (link "View source code for this page" "/source-t")))
Arc vs. Python
I implemented a similar Arduino graph server in Python a few weeks ago. Overall, both Python and Arc make it easy to set up a simple web server. Comparing the Python code with the Arc code reveals Arc's lack of libraries.The first problem with Arc is it doesn't have a serial library, so I can't configure the baud rate and parameters on my serial port from Arc. I'm just assuming it's set up right, and that's working but not very robust.
The second problem I encountered was creating the timestamps on the data. The latest version of Arc has a timedate function to generate a timestamp but unfortunately that's only in GMT. I tried writing a routine to convert the time to the local timezone, but that got rather annoying. In addition, Arc doesn't have any printf-like formatting, so I had to make my own formatting routine to generate zero-padded strings of the form "12:05". I rapidly decided that writing timezone functions wasn't what I wanted to do, and ended up just using the Unix date command. (This confirm's "kens' law": Any sufficiently complicated Arc application requries the use of 'system to get things done.)
; return a timestamp of the form 2009-08-20 19:22
(= tz "America/Los_Angeles")
(def gettimestamp ()
  (trim (tostring (system (string "TZ=" tz " date +'%m-%d-%Y %H:%M'")))))
I'd have to say that Python is clearly the easier solution overall.
Hardware details
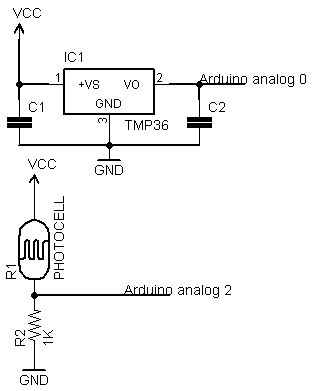
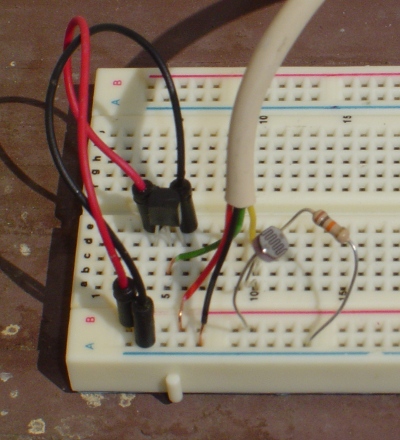 The circuit is pretty trivial. It measures light with a photocell and temperature with a TMP36 temperature sensor (tutorial). (The TMP36 is the three-wire black part that looks like a transistor.) These parts generate voltages that are read by the Arduino's analog-to-digital converters. The temperature sensor's voltage directly gives the Celsius temperature, while the photocell's light measurement is not calibrated to anything.
I had several problems with temperature measurement. First, the Arduino's A/D converter converts relative to its power supply voltage, so the temperature is only as stable as the power supply, and must be manually calibrated. Second, the 10 feet of unshielded phone wire between the Arduino and the temperature sensor introduced a lot of noise. Notice the 10 degree fluctuations on the first day of measurement. I added bypass capacitors after the first day, and the measurements are much smoother. Finally, the temperature sensor heats up a lot when the direct sun hits it in the late afternoon, apparently reaching 140° F. I guess there's a reason why real meteorologists put their temperature sensors in sheltered boxes instead of directly in the sun.
If I were doing this again, I'd probably use a digital temperature sensor such as the One-wire DS18B20; this would avoid the analog calibration and noise issues.
It would be cool to replace the wire between the Arduino and the sensors with Xbee wireless networking. Since I don't have any Xbees, the wire will have to suffice for now.
The photocell voltage is generated from a simple resistor divider. After the second day I changed the resistor from 10K to 1K so the curve wouldn't saturate in the bright sun. (10K worked fine indoors, but outdoors is much brighter.) You can see the break in the green line where I changed resistors.
Conclusion
Arc and the SheevaPlug have been more reliable than I expected; my code has been running for a couple of weeks without problems. I think the SheevaPlug makes a good platform for this sort of project. Using Arc, however, is more of an "experimental curiosity"; I'd recommend a different language unless you really want to use Arc.I have a few other related postings:
- World's smallest Arc server: details on how I run Arc on the SheevaPlug, as well as an interactive poll application.
- Arduino + SheevaPlug: how to use the Arduino with the SheevaPlug, using Python for the web server and to communicate with the Arduino.
- Documentation of Arc's web server
cool hack! I'm tempted to get a sheevaplug :)
ReplyDelete-Conrad Barski
Hope these comments aren't too much about sucking eggs, but:
ReplyDeleteNote that I've hardwired the supply voltage, as it's needed for the conversion.
Couldn't you put a zener diode or similar voltage reference on another of the analog inputs, one for about 3 or 4 volts perhaps, and use that to work out the supply voltage?
The first problem with Arc is it doesn't have a serial library, so I can't configure the baud rate and parameters on my serial port from Arc.
(system (stty ...)) ?
Hey Ken,
ReplyDeleteDid you use the arc and sheevaplug as an experiment with arc/arduino? You could have just run the webserver on the arduino directly and used a wifi/ethernet shield. The wifi shield is <= the cost of a sheevaplug.