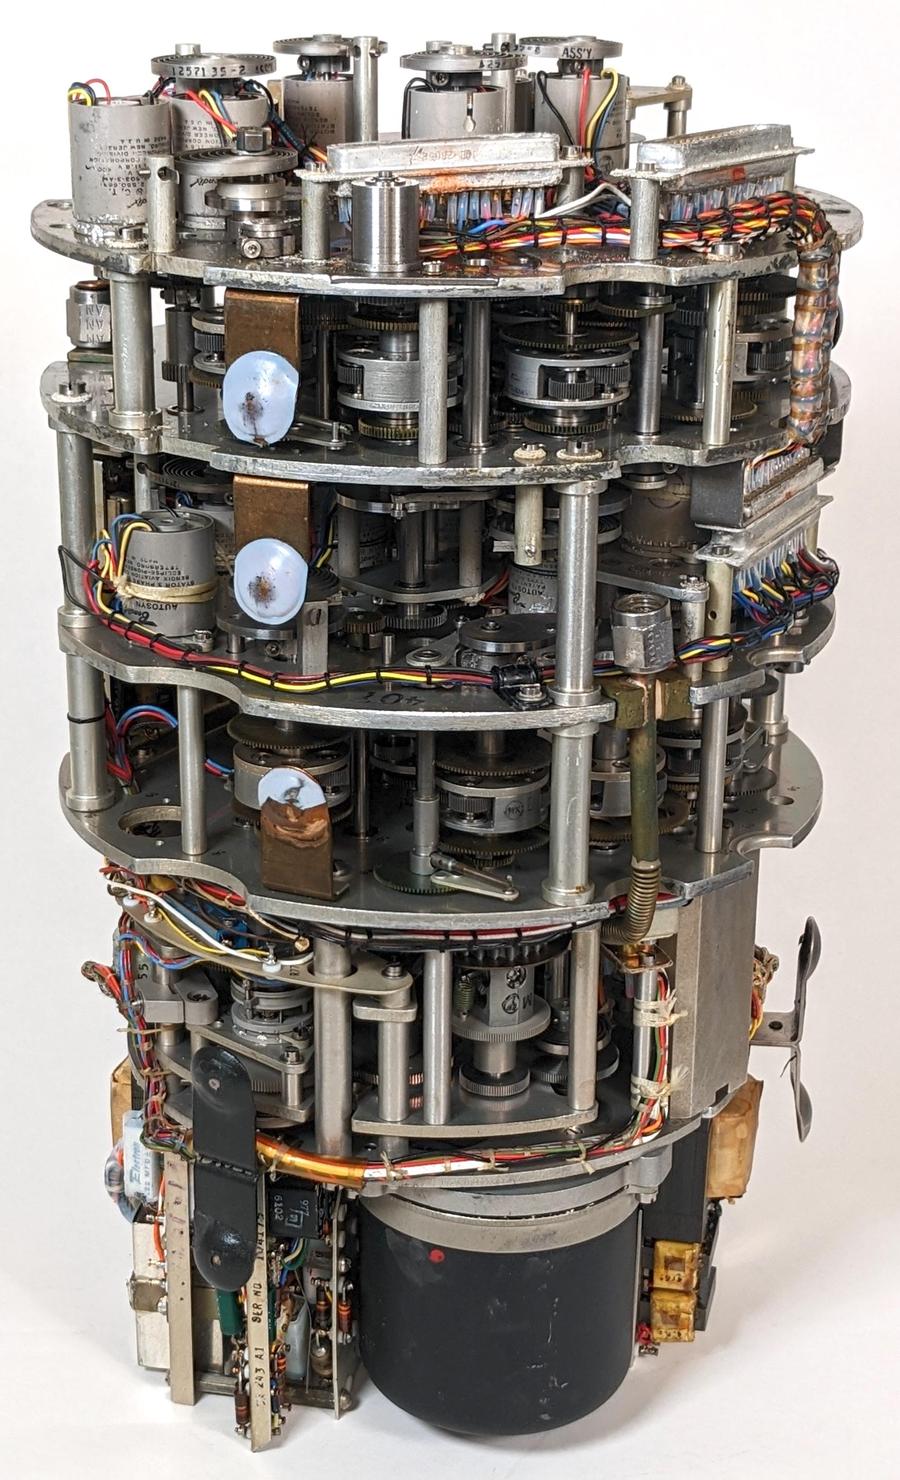
Determining the airspeed and altitude of a fighter plane is harder than you'd expect. At slower speeds, pressure measurements can give the altitude, air speed, and other "air data". But as planes approach the speed of sound, complicated equations are needed to accurately compute these values. The Bendix Central Air Data Computer (CADC) solved this problem for military planes such as the F-101 and the F-111 fighters, and the B-58 bomber.1 This electromechanical marvel was crammed full of 1955 technology: gears, cams, synchros, and magnetic amplifiers. In this blog post I look inside the CADC, describe the calculations it performed, and explain how it performed these calculations mechanically.
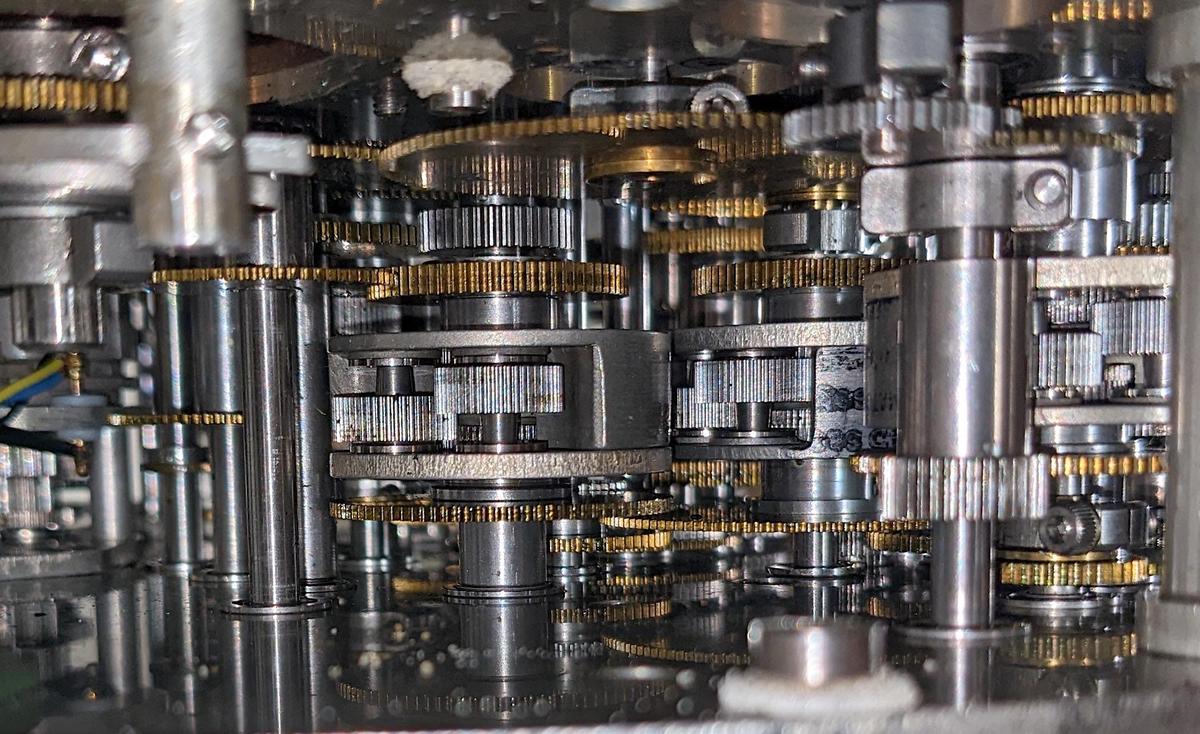
This analog computer performs calculations using rotating shafts and gears, where the angle of rotation indicates a numeric value. Differential gears perform addition and subtraction, while cams implement functions. The CADC is electromechanical, with magnetic amplifiers providing feedback signals and three-phase synchros providing electrical outputs. It is said to contain 46 synchros, 511 gears, 820 ball bearings, and a total of 2,781 major parts. The photo below shows a closeup of the gears.
What it does
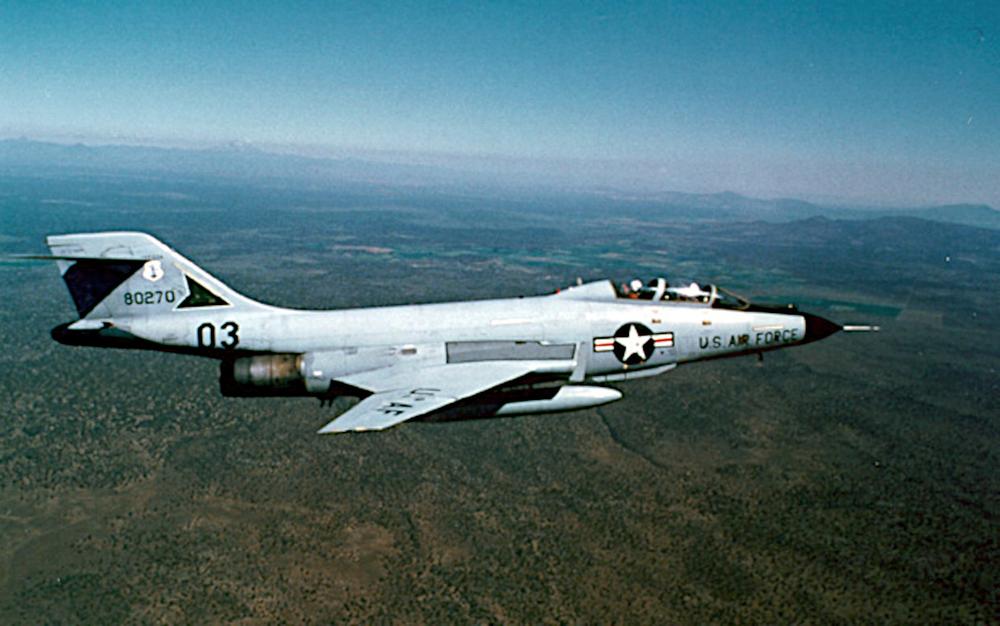
For over a century, aircraft have determined airspeed from air pressure. A port in the side of the plane provides the static air pressure,2 which is the air pressure outside the aircraft. A pitot tube points forward and receives the "total" air pressure, a higher pressure due to the speed of the airplane forcing air into the tube. (In the photo below, you can see the long pitot tube sticking out from the nose of a F-101.) The airspeed can be determined from the ratio of these two pressures, while the altitude can be determined from the static pressure.
But as you approach the speed of sound, the fluid dynamics of air change and the calculations become very complicated. With the development of supersonic fighter planes in the 1950s, simple mechanical instruments were no longer sufficient. Instead, an analog computer to calculate the "air data" (airspeed, altitude, and so forth) from the pressure measurements. One option would be for each subsystem (instruments, weapons control, engine control, etc) to compute the air data separately. However, it was more efficient to have one central system perform the computation and provide the data electrically to all the subsystems that need it. This system was called a Central Air Data Computer or CADC.
The Bendix CADC has two pneumatic inputs through tubes: the static pressure3 and the total pressure. It also receives the total temperature from a platinum temperature probe. From these, it computes many outputs: true air speed, Mach number, log static pressure, differential pressure, air density, air density × the speed of sound, total temperature, and log true free air temperature.
The CADC implemented a surprisingly complex set of functions derived from fluid dynamics equations describing the behavior of air at various speeds and conditions. First, the Mach number is computed from the ratio of total pressure to static pressure. Different equations are required for subsonic and supersonic flight. Although this equation looks difficult to solve mathematically, fundamentally M is a function of one variable ($P_t / P_s$), and this function is encoded in the shape of a cam. (You are not expected to understand the equations below. They are just to illustrate the complexity of what the CADC does.)
\[M<1:\] \[~~~\frac{P_t}{P_s} = ( 1+.2M^2)^{3.5}\]
\[M > 1:\]
\[~~~\frac{P_t}{P_s} = \frac{166.9215M^7}{( 7M^2-1)^{2.5}}\]
Next, the temperature is determined from the Mach number and the temperature indicated by a temperature probe.
\[T = \frac{T_{ti}}{1 + .2 M^2} \]
The indicated airspeed and other outputs are computed in turn, but I won't go through all the equations. Although these equations may seem ad hoc, they can be derived from fluid dynamics principles. These equations were standardized in the 1950s by various government organizations including the National Bureau of Standards and NACA (the precursor of NASA). While the equations are complicated, they can be computed with mechanical means.
How it is implemented
The Air Data Computer is an analog computer that determines various functions of the static pressure, total pressure and temperature. An analog computer was selected for this application because the inputs are analog and the outputs are analog, so it seemed simplest to keep the computations analog and avoid conversions. The computer performs its computations mechanically, using the rotation angle of shafts to indicate values. For the most part, values are represented logarithmically, which allows multiplication and division to be implemented by adding and subtracting rotations. A differential gear mechanism provides the underlying implementation of addition and subtraction. Specially-shaped cams provide the logarithmic and exponential conversions as necessary. Other cams implement various arbitrary functions.
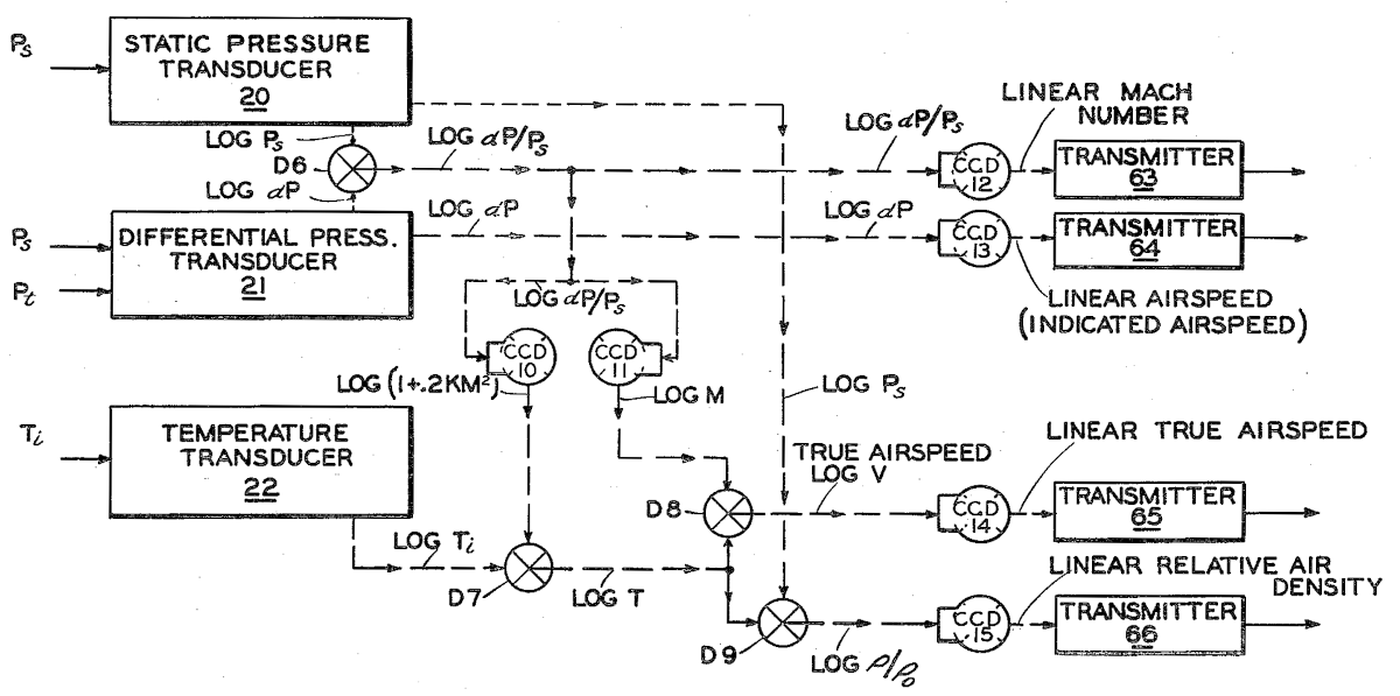
The diagram below, from patent 2,969,210, shows some of the operations. At the left, transducers convert the pressure and temperature inputs from physical quantities into shaft rotations, applying a log function in the process. Subtracting the two pressures with a differential gear mechanism (X-in-circle symbol) produces the log of the pressure ratios. Cam "CCD 12" generates the Mach number from this log pressure ratio, still expressed as a shaft rotation. A synchro transmitter converts the shaft rotation into a three-phase electrical output from the CADC. The remainder of the diagram uses more cams and differentials to produce the other outputs. Next, I'll discuss how these steps are implemented.
The pressure transducer
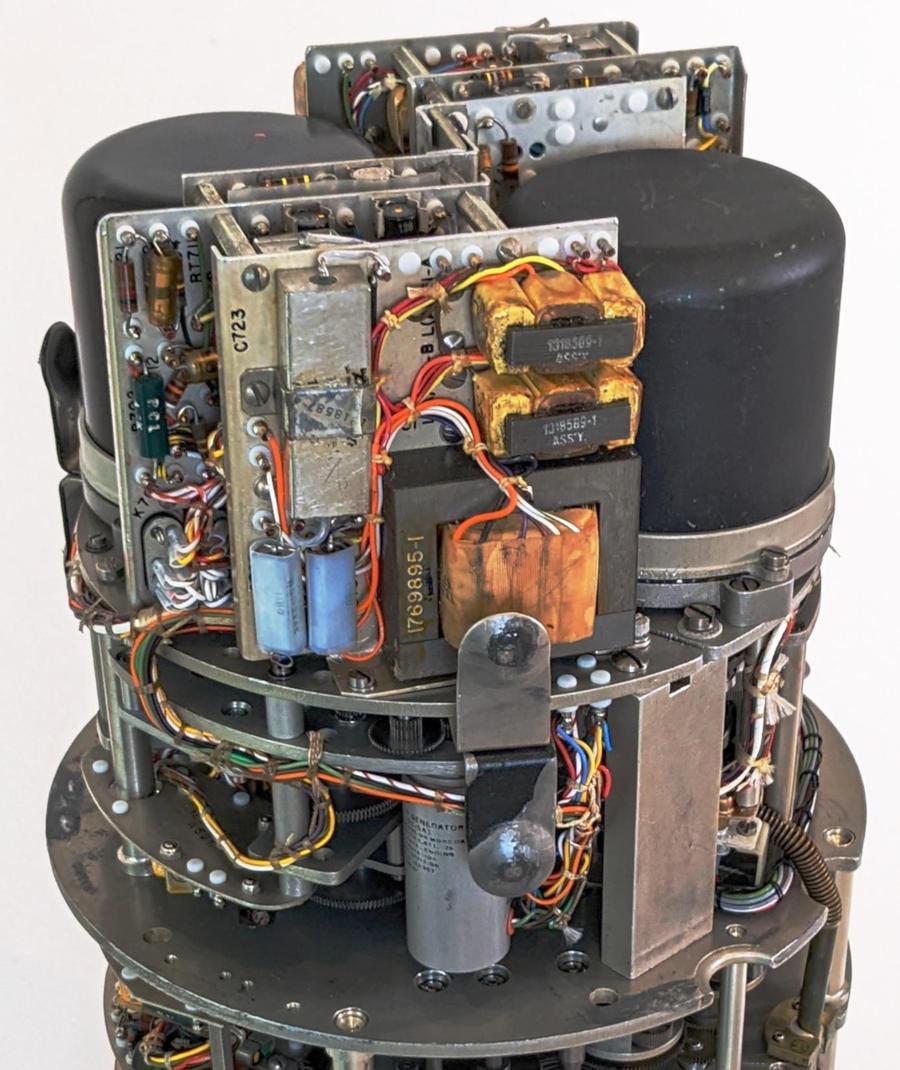
The CADC receives the static and total pressure through tubes connected to the front of the CADC. (At the lower right, one of these tubes is visible.) Inside the CADC, two pressure transducers convert the pressures into rotational signals. The pressure transducers are the black domed cylinders at the top of the CADC.
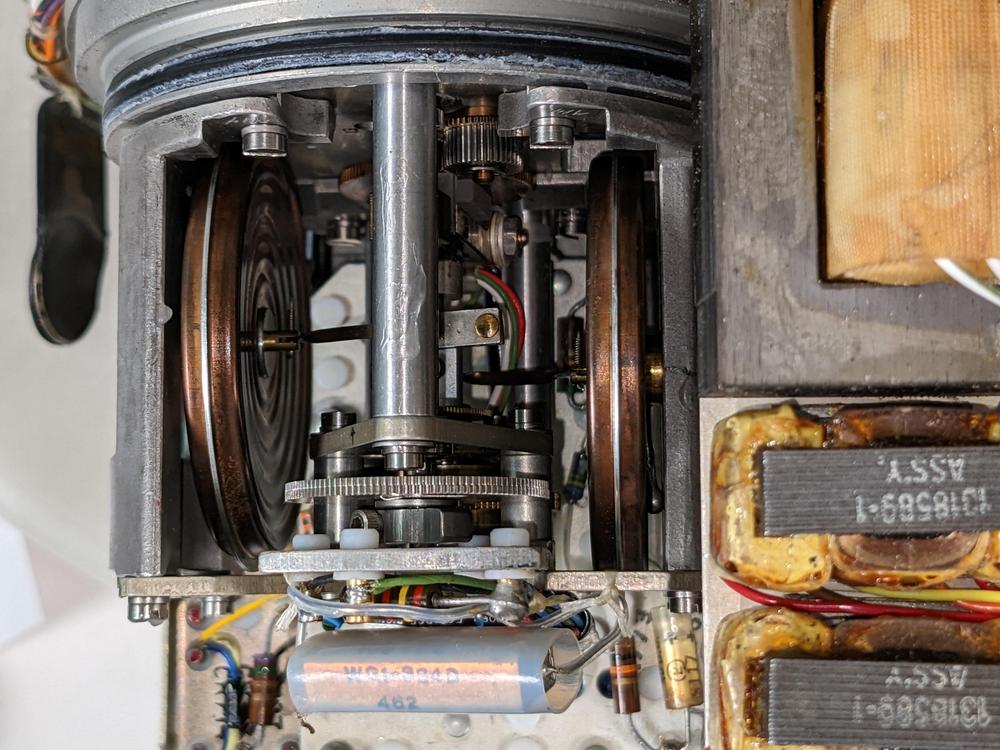
Each pressure transducer contains a pair of bellows that expand and contract as the applied pressure changes. They are connected to opposite sides of a shaft so they cause small rotations of the shaft.
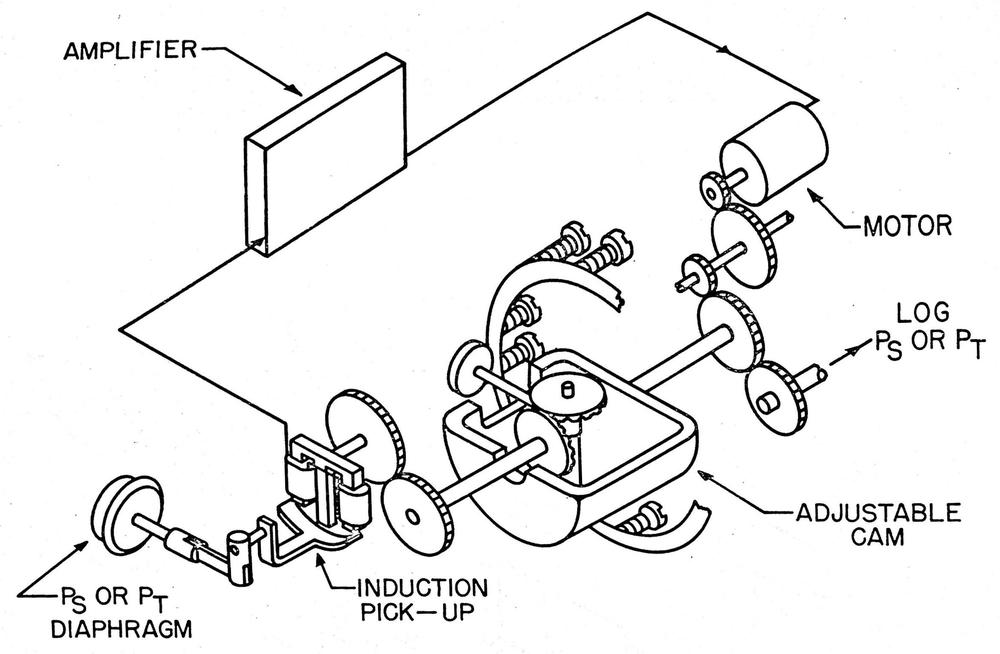
The pressure transducer has a tricky job: it must measure tiny pressure changes, but it must also provide a rotational signal that has enough torque to rotate all the gears in the CADC. To accomplish this, the pressure transducer uses a servo loop. The bellows produce a small shaft motion that is detected by an inductive pickup. This signal is amplified and drives a motor with enough power to move all the gears. The motor is also geared to counteract the movement of the bellows. This creates a feedback loop so the motor's rotation tracks the air pressure, but provides much more force. A cam is used so the output corresponds to the log of the input pressure.
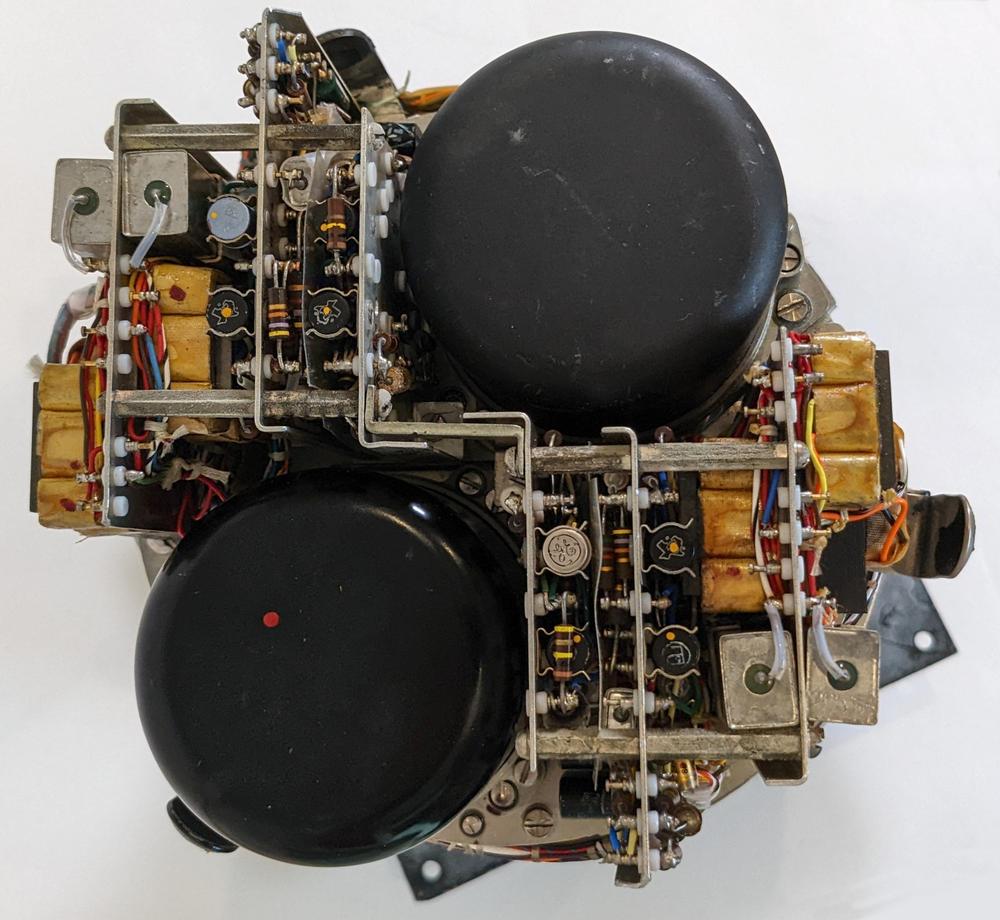
Each transducer signal is amplified by three circuit boards centered around a magnetic amplifier, a transformer-like amplifier circuit that was popular before high-power transistors came along. The photo below shows how the amplifier boards are packed next to the transducers. The boards are complex, filled with resistors, capacitors, germanium transistors, diodes, relays, and other components.
Temperature
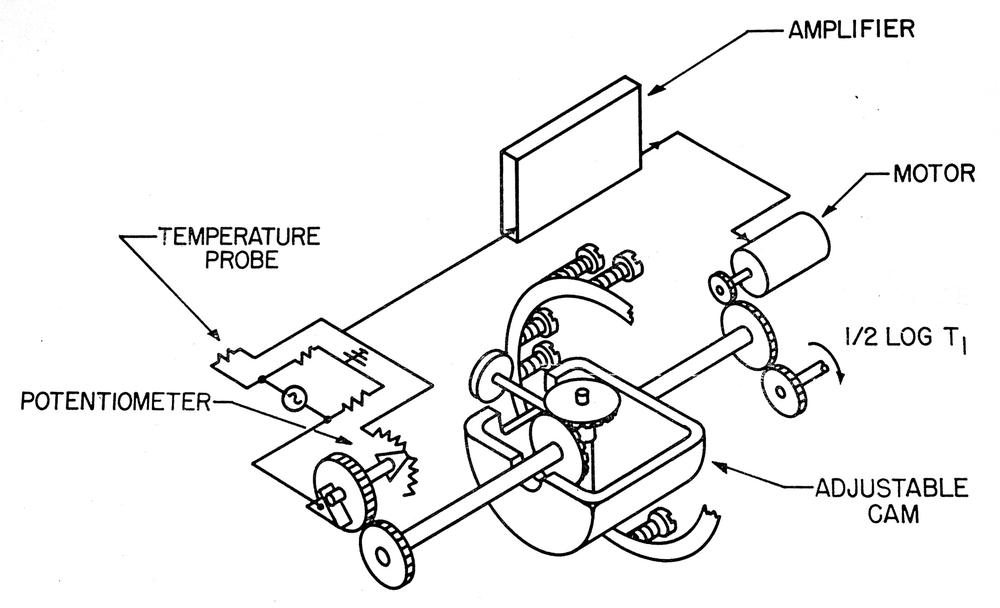
The external temperature is an important input to the CADC since it affects the air density. A platinum temperature probe provides a resistance4 that varies with temperature. The resistance is converted to rotation by an electromechanical transducer mechanism. Like the pressure transducer, the temperature transducer uses a servo mechanism with an amplifier and feedback loop. For the temperature transducer, though, the feedback signal is generated by a resistance bridge using a potentiometer driven by the motor. By balancing the potentiometer's resistance with the platinum probe's resistance, a shaft rotation is produced that corresponds to the temperature. The cam is configured to produce the log of the temperature as output.
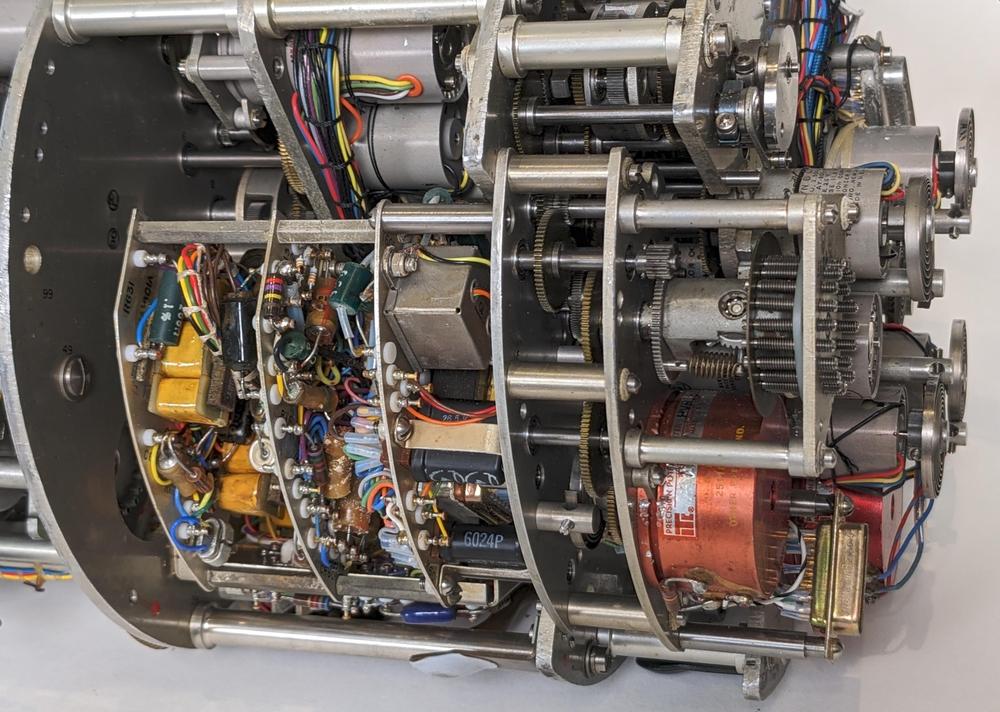
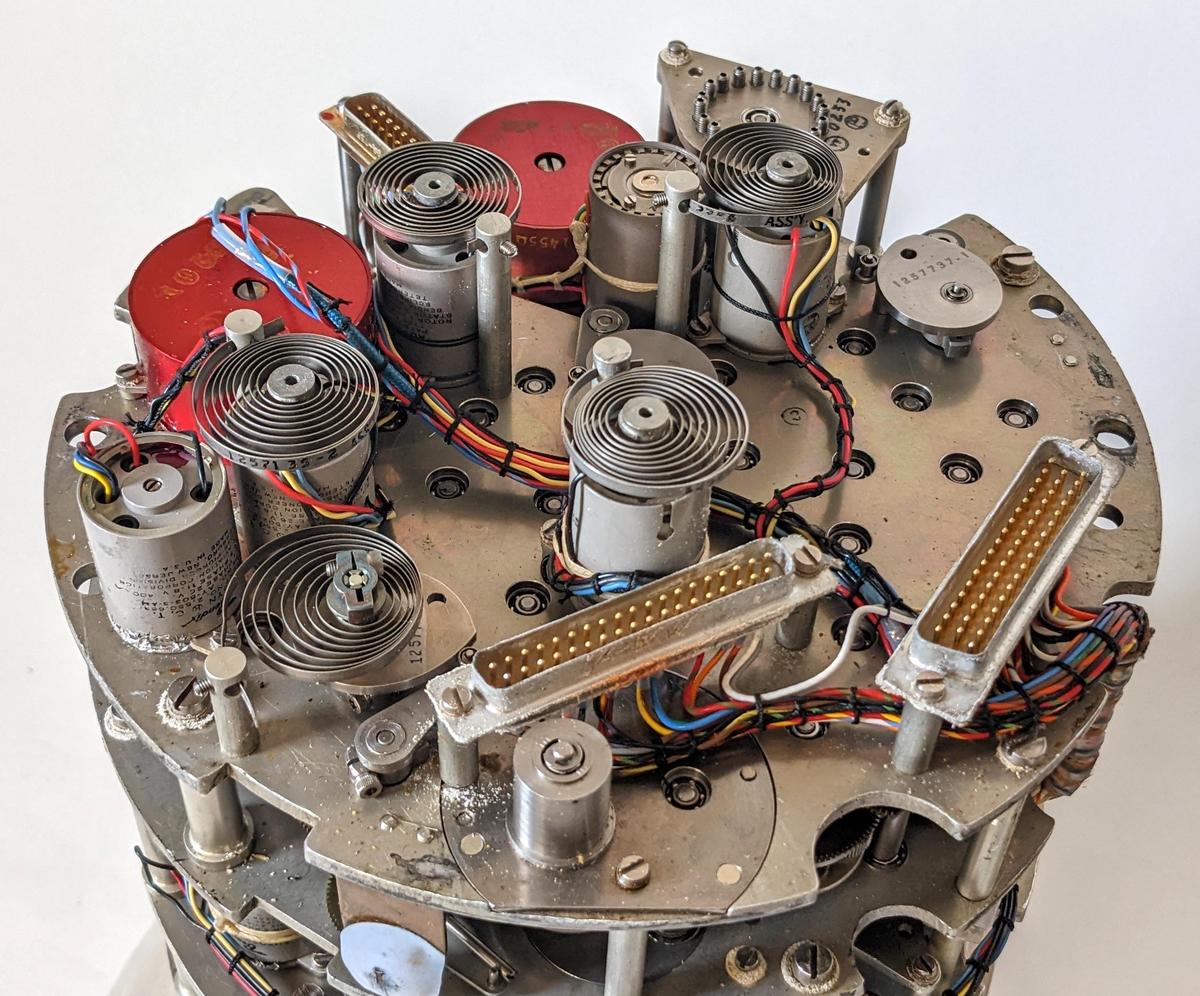
The temperature transducer section of the CADC is shown below. The feedback potentiometer is the red cylinder at the lower right. Above it is a metal-plate adjustment cam, which will be discussed below. The CADC is designed in a somewhat modular way, with the temperature section implemented as a removable wedge-shaped unit, the lower two-thirds of the photo. The temperature transducer, like the pressure transducer, has three boards of electronics to implement the feedback amplifier and drive the motor.
The differential
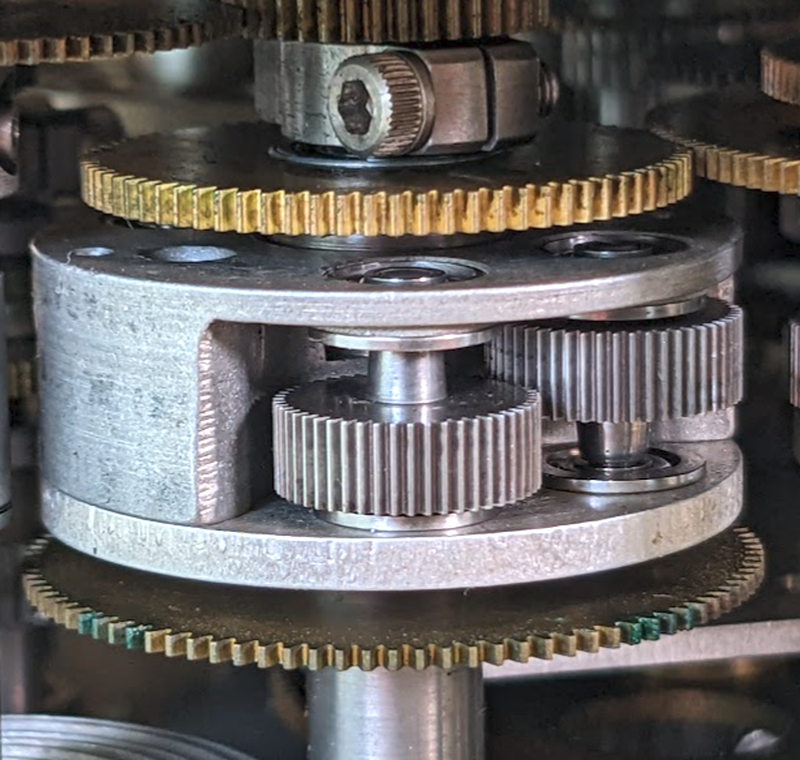
The differential gear assembly is a key component of the CADC's calculations, as it performs addition or subtraction of rotations: the rotation of the output shaft is the sum or difference of the input shafts, depending on the direction of rotation.5 When rotations are expressed logarithmically, addition and subtraction correspond to multiplication and division. This differential is constructed as a spur-gear differential. It has inputs at the top and bottom, while the body of the differential rotates to produce the sum. The two visible gears in the body mesh with the internal input gears, which are not visible. The output is driven by the body through a concentric shaft.
The cams
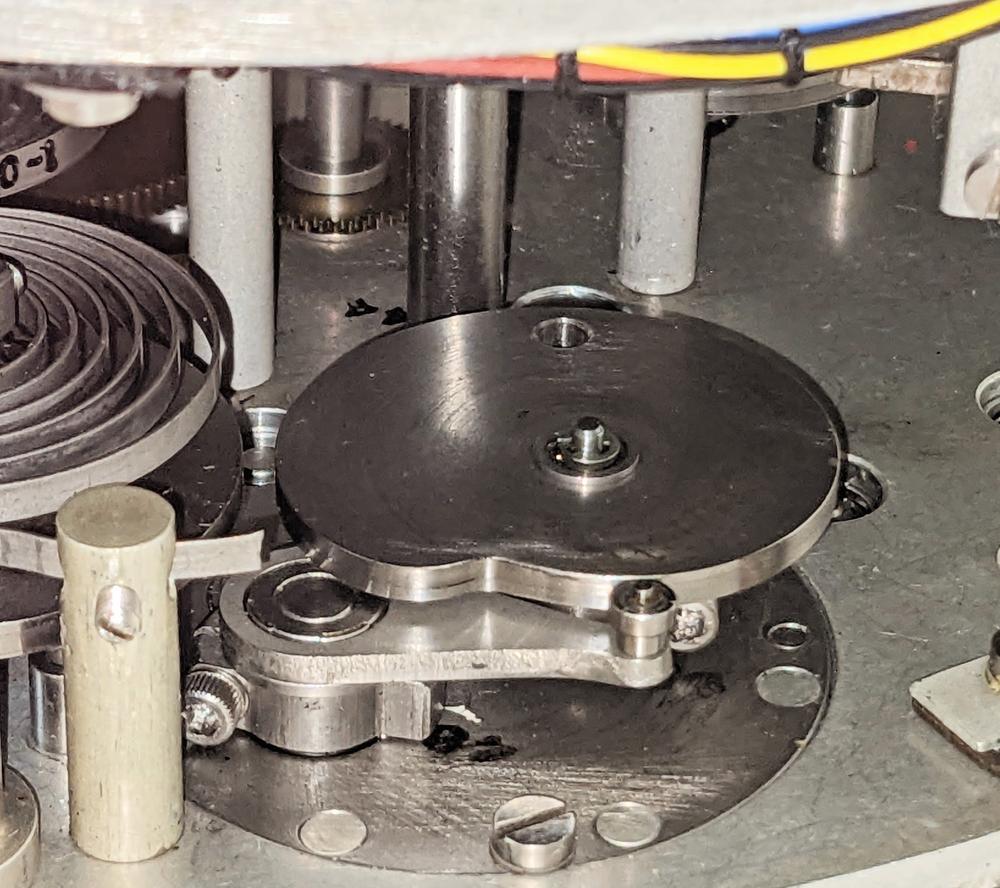
The CADC uses cams to implement various functions. Most importantly, cams perform logarithms and exponentials. Cams also implement more complex functions of one variable such as ${M}/{\sqrt{1 + .2 M^2}}$. The photo below shows a cam (I think exponential) with the follower arm in front. As the cam rotates, the follower moves in and out according to the cam's radius, providing the function value.
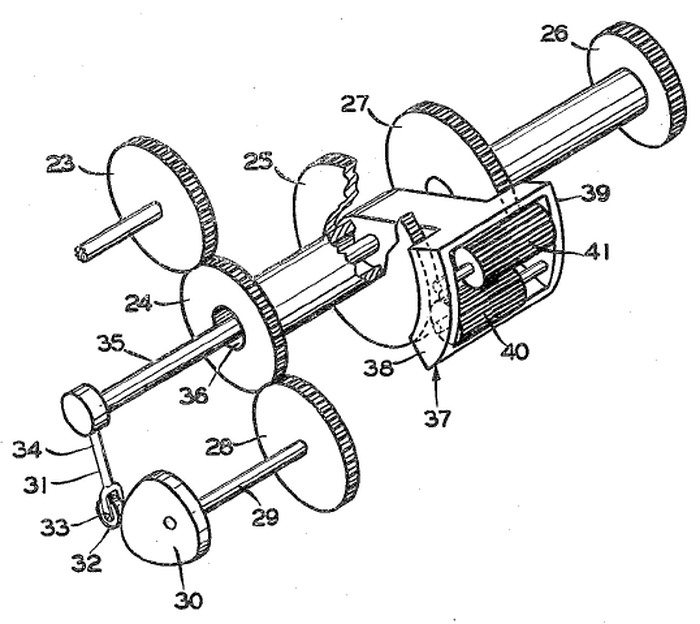
The cams are combined with a differential in a clever way to make the cam shape more practical, as shown below.6 The input (23) drives the cam (30) and the differential (37-41). The follower (32) tracks the cam and provides a second input (35) to the differential. The sum from the differential produces the output (26).
The warped plate cam
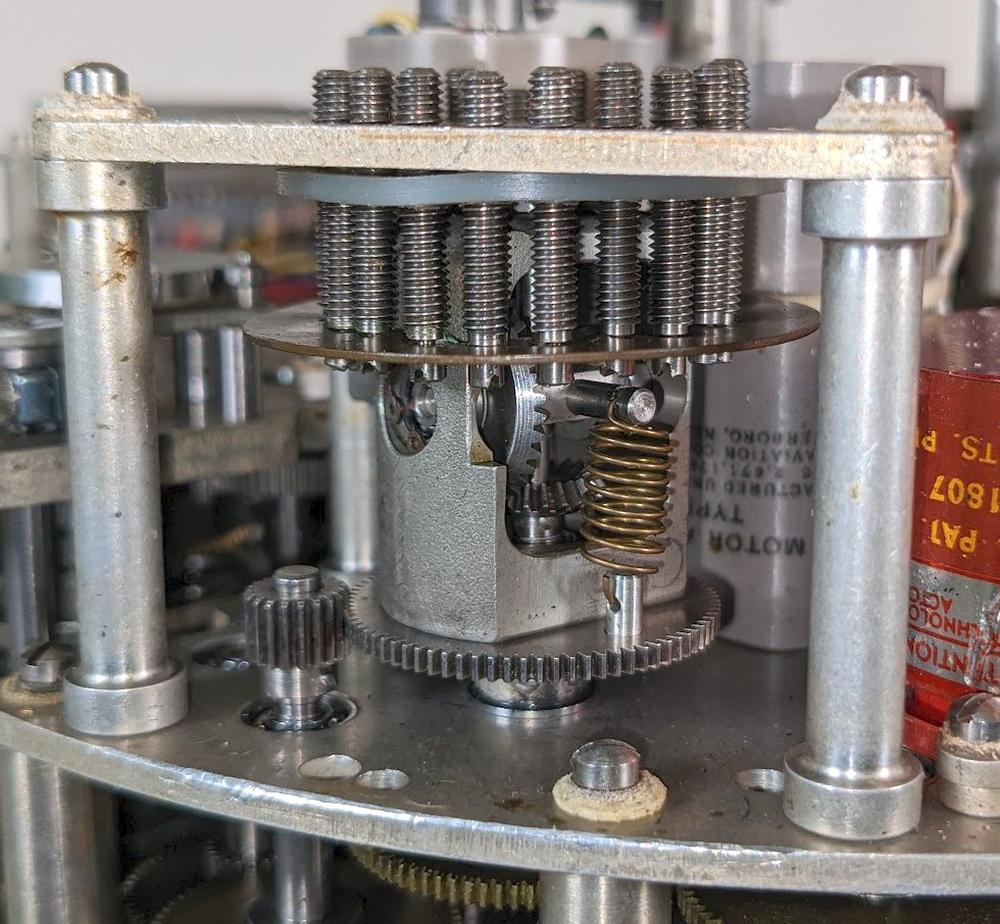
Some functions are implemented by warped metal plates acting as cams. This type of cam can be adjusted by turning the 20 setscrews to change the shape of the plate. A follower rides on the surface of the cam and provides an input to a differential underneath the plate. The differential adds the cam position to the input rotation, producing a modified rotation, as with the solid cam. The pressure transducer, for instance, uses a cam to generate the desired output function from the bellows deflection. By using a cam, the bellows can be designed for good performance without worrying about its deflection function.
The synchro outputs
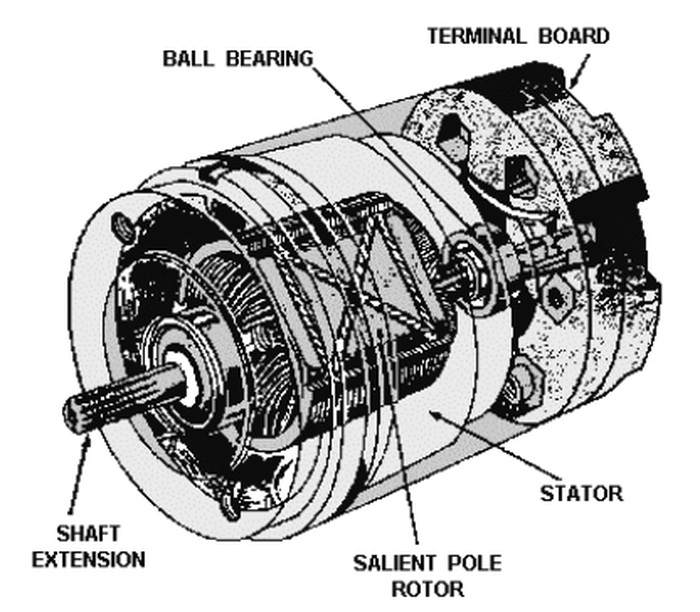
Most of the outputs from the CADC are synchro signals.7 A synchro is an interesting device that can transmit a rotational position electrically over three wires. In appearance, a synchro is similar to an electric motor, but its internal construction is different, as shown below. In use, two synchros have their stator windings connected together, while the rotor windings are driven with AC. Rotating the shaft of one synchro causes the other to rotate to the same position. I have a video showing synchros in action here.
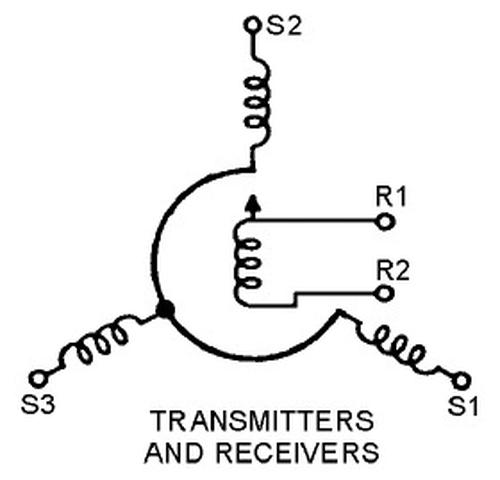
Internally, a synchro has a moving rotor winding and three fixed stator windings. When AC is applied to the rotor, voltages are developed on the stator windings depending on the position of the rotor. These voltages produce a torque that rotates the synchros to the same position. In other words, the rotor receives power (26 V, 400 Hz in this case), while the three stator wires transmit the position. The diagram below shows how a synchro is represented schematically, with rotor and stator coils.
Before digital systems, synchros were very popular for transmitting signals electrically through an aircraft. For instance, a synchro could transmit an altitude reading to a cockpit display or a targeting system. For the CADC, most of the outputs are synchro signals, which convert the rotational values of the CADC to electrical signals. The three stator windings from the synchro inside the CADC are wired to an external synchro that receives the rotation. For improved resolution, many of these outputs use two synchros: a coarse synchro and a fine synchro. The two synchros are typically geared in an 11:1 ratio, so the fine synchro rotates 11 times as fast as the coarse synchro. Over the output range, the coarse synchro may turn 180°, providing the approximate output, while the fine synchro spins multiple times to provide more accuracy.
The air data system
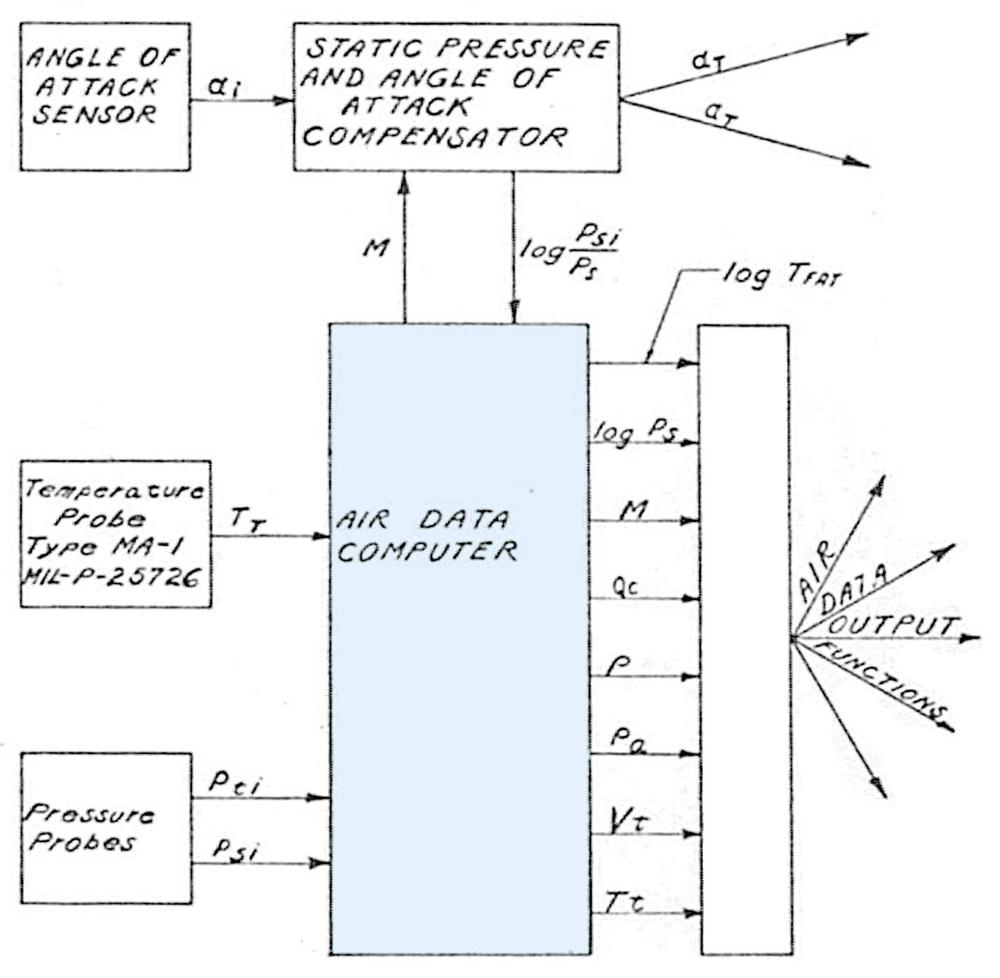
The CADC is one of several units in the system, as shown in the block diagram below.8 The outputs of the CADC go to another box called the Air Data Converter, which is the interface between the CADC and the aircraft systems that require the air data values: fire control, engine control, navigation system, cockpit display instruments, and so forth. The motivation for this separation is that different aircraft types have different requirements for signals: the CADC remains the same and only the converter needed to be customized. Some aircraft required "up to 43 outputs including potentiometers, synchros, digitizers, and switches."
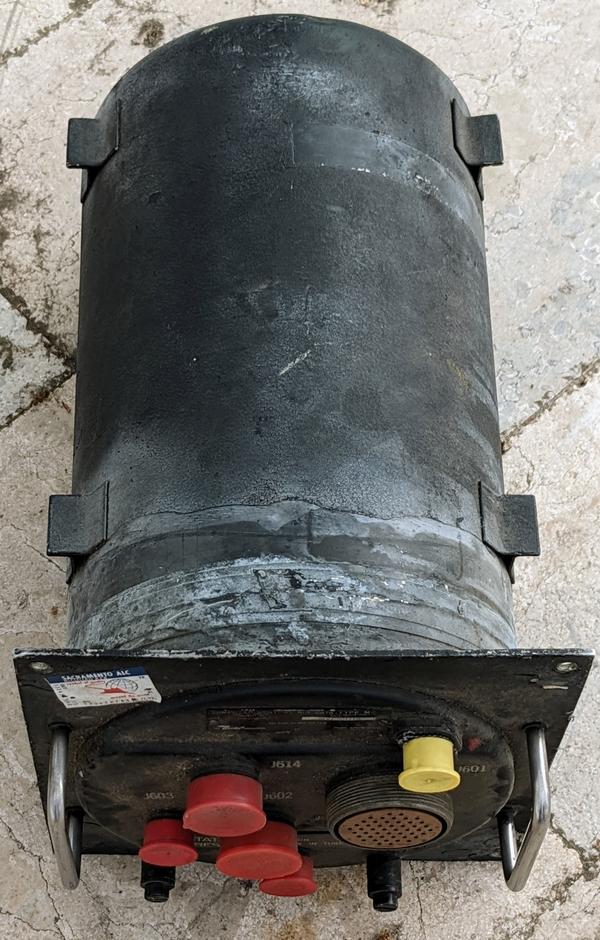
The CADC was also connected to a cylindrical unit called the "Static pressure and angle of attack compensator." This unit compensates for errors in static pressure measurements due to the shape of the aircraft by producing the "position error correction". Since the compensation factor depended on the specific aircraft type, the compensation was computed outside the Central Air Data Computer, again keeping the CADC generic. This correction factor depends on the Mach number and angle of attack, and was implemented as a three-dimensional cam. The cam's shape (and thus the correction function) was determined empirically, rather than from fundamental equations.
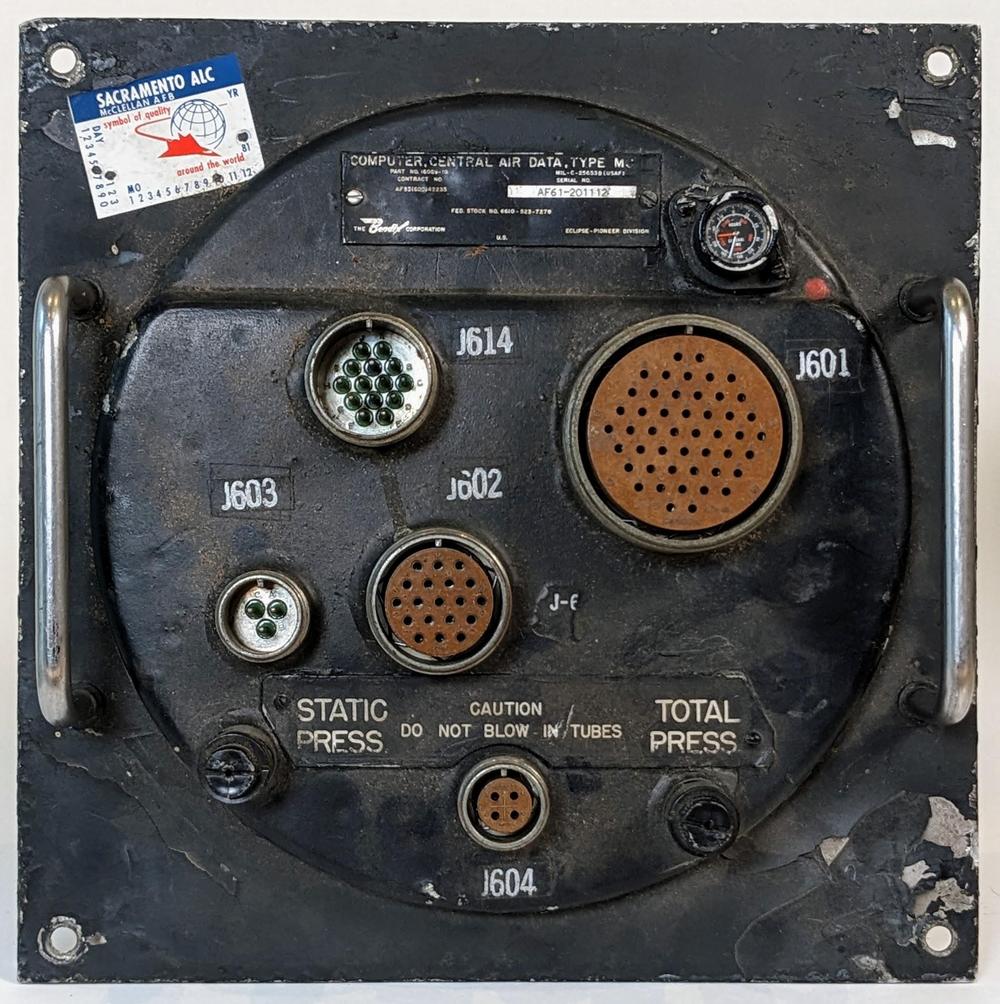
The CADC was wired to other components through five electrical connectors as shown in the photo below.9 At the bottom are the pneumatic connections for static pressure and total pressure. At the upper right is a small elapsed time meter.
Conclusions
The Bendix MG-1A Central Air Data Computer is an amazingly complex piece of electromechanical hardware. It's hard to believe that this system of tiny gears was able to perform reliable computations in the hostile environment of a jet plane, subjected to jolts, accelerations, and vibrations. But it was the best way to solve the problem at the time,10 showing the ingenuity of the engineers who developed it.
I plan to continue reverse-engineering the Bendix CADC and hope to get it operational,11 so follow me on Twitter @kenshirriff or RSS for updates. I've also started experimenting with Mastodon recently as @oldbytes.space@kenshirriff. Until then, you can check out CuriousMarc's video below to see more of the CADC. Thanks to Joe for providing the CADC. Thanks to Nancy Chen for obtaining a hard-to-find document for me.
Notes and references
-
I haven't found a definitive list of which planes used this CADC. Based on various sources, I believe it was used in the F-86, F-101, F-104, F-105, F-106, and F-111, and the B-58 bomber. ↩
-
The static air pressure can also be provided by holes in the side of the pitot tube. I couldn't find information indicating exactly how these planes received static pressure. ↩
-
The CADC also has an input for the "position error correction". This provides a correction factor because the measured static pressure may not exactly match the real static pressure. The problem is that the static pressure is measured from a port on the aircraft. Distortions in the airflow may cause errors in this measurement. A separate box, the "compensator", determines the correction factor based on the angle of attack. ↩
-
The platinum temperature probe is type MA-1, defined by specification MIL-P-25726. It apparently has a resistance of 50 Ω at 0 °C. ↩
-
Strictly speaking, the output of the differential is the sum of the inputs divided by two. I'm ignoring the factor of 2 because the gear ratios can easily cancel it out. ↩
-
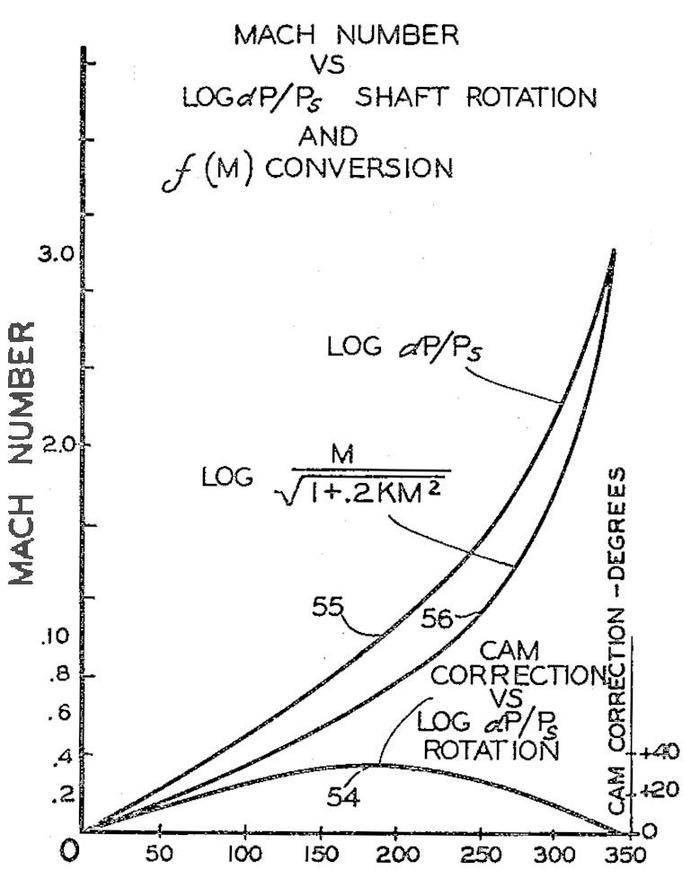
Cams are extensively used in the CADC to implement functions of one variable, including exponentiation and logarithms. The straightforward way to use a cam is to read the value of the function off the cam directly, with the radius of the cam at each angle representing the value. This approach encounters a problem when the cam wraps around, since the cam's profile will suddenly jump from one value to another. This poses a problem for the cam follower, which may get stuck on this part of the cam unless there is a smooth transition zone. Another problem is that the cam may have a large range between the minimum and maximum outputs. (Consider an exponential output, for instance.) Scaling the cam to a reasonable size will lose accuracy in the small values. The cam will also have a steep slope for the large values, making it harder to track the profile.
The solution is to record the difference between the input and the output in the cam. A differential then adds the input value to the cam value to produce the desired value. The clever part is that by scaling the input so it matches the output at the start and end of the range, the difference function drops to zero at both ends. Thus, the cam profile matches when the angle wraps around, avoiding the sudden transition. Moreover, the difference between the input and the output is much smaller than the raw output, so the cam values can be more accurate. (This only works because the output functions are increasing functions; this approach wouldn't work for a sine function, for instance.)
This diagram, from Patent 2969910, shows how a cam implements a complex function.The diagram above shows how this works in practice. The input is \(log~ dP/P_s\) and the output is \(log~M / \sqrt{1+.2KM^2}\). (This is a function of Mach number used for the temperature computation; K is 1.) The small humped curve at the bottom is the cam correction. Although the input and output functions cover a wide range, the difference that is encoded in the cam is much smaller and drops to zero at both ends. ↩
-
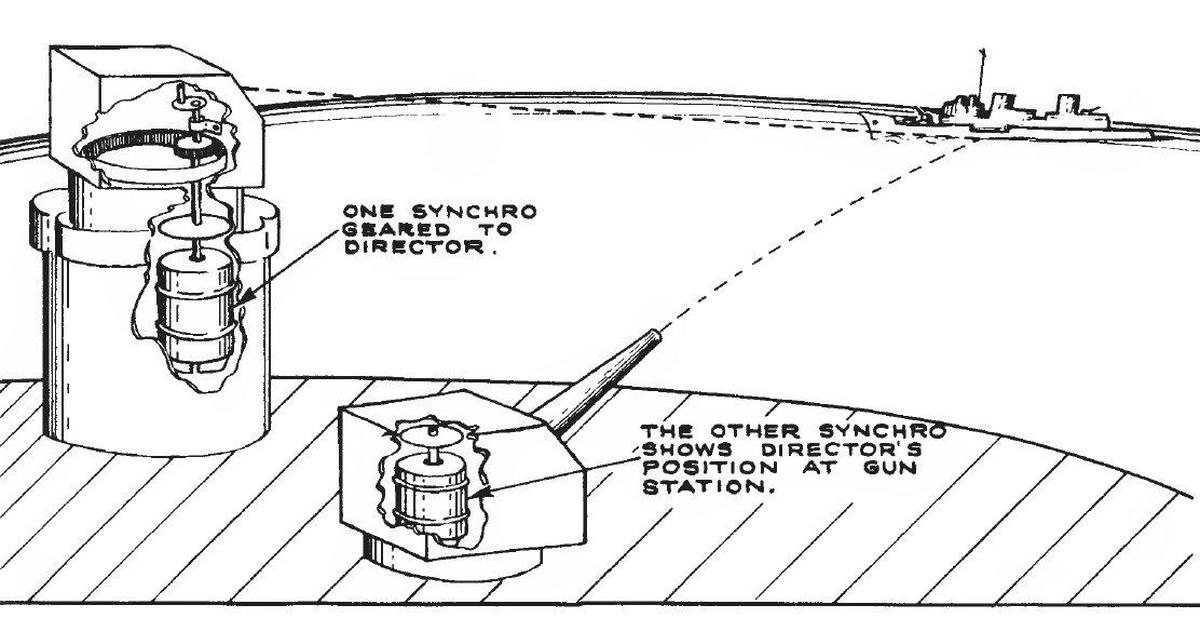
The US Navy made heavy use of synchros for transmitting signals throughout ships. The synchro diagrams are from two US Navy publications: US Navy Synchros (1944) and Principles of Synchros, Servos, and Gyros (2012). These are good documents if you want to learn more about synchros. The diagram below shows how synchros could be used on a ship.
A Navy diagram illustrating synchros controlling a gun on a battleship. -
To summarize the symbols, the outputs are: log TFAT: true free air temperature (the ambient temperature without friction and compression); log Ps: static pressure; M: Mach number; Qc: differential pressure; ρ: air density; ρa: air density times the speed of sound; Vt: true airspeed. Tt: total temperature (higher due to compression of the air). Inputs are: TT: total temperature (higher due to compression of the air). Pti: indicated total pressure (higher due to velocity); Psi: indicated static pressure; log Psi/Ps: the position error correction from the compensator. The compensator uses input αi: angle of attack; and produces αT: true angle of attack; aT: speed of sound. ↩
-
The electrical connectors on the CADC have the following functions: J614: outputs to the converter, J601: outputs to the converter, J603: AC power (115 V, 400 Hz), J602: to/from the compensator, and J604: input from the temperature probe. ↩
-
An interesting manual way to calculate air data was with a circular slide rule, designed for navigation and air data calculation. It gave answers for various combinations of pressure, temperature, Mach number, true airspeed, and so forth. See the MB-2A Air Navigation Computer instructions for details. Also see patent 2528518. I'll also point out that from the late 1800s through the 1940s and on, the term "computer" was used for any sort of device that computed a value, from an adding machine to a slide rule (or even a person). The meaning is very different from the modern usage of "computer". ↩
-
It was very difficult to find information about the CADC. The official military specification is MIL-C-25653C(USAF). After searching everywhere, I was finally able to get a copy from the Technical Reports & Standards unit of the Library of Congress. The other useful document was in an obscure conference proceedings from 1958: "Air Data Computer Mechanization" (Hazen), Symposium on the USAF Flight Control Data Integration Program, Wright Air Dev Center US Air Force, Feb 3-4, 1958, pp 171-194. ↩
6 comments:
I *think* the North American FJ-4 Fury used this CADC, and also the A-5 Vigilante.
Don't forget the Instrument Units of the Saturn 1-B and S-V both had CADC units, although I'm not sure which ones (it seems remarkably difficult to find information about these critical navigation and flight control systems - IBM, huh?).
Great work Ken.
Can you share where you found “Air Data Computer Mechanization" (Hazen), Symposium on the USAF Flight Control Data Integration Program, Wright Air Dev Center US Air Force, Feb 3-4, 1958, pp 171-194?
I cannot locate on the web.
The conference proceedings is not available on the web. I had to get it from the UCLA library.
Reminds me of the Antikythera mechanism, v 2.0.
Thanks - fascinating to see what could be done mechanically before the advent of digital computers!
I did want to point out a small inaccuracy. The article states that "The airspeed can be determined from the ratio of these two pressures" (total pressure and dynamic pressure). In fact, airspeed is computed from the difference between total and static pressure. This difference is called the dynamic pressure, denoted by q, and it is related to the true airspeed v by the relationship
q = 1/2 rho v^2
where rho is the air density.
Martin, your equation is correct, but assumes incompressible flow, so anything below M 0.3. As this was meant for a jet fighter, you would get into the compressible regime, where in fact the pressure ratios start to matter. See e.g. here: https://www.efunda.com/designstandards/sensors/pitot_tubes/pitot_tubes_theory.cfm for those equations.
Post a Comment